
Short answer. Open interest is the total size of derivatives positions that are still open, usually counted once per long/short pair. It is a stock; volume is a flow. OI tells you how much leveraged exposure is in the market right now, and it only means something next to price and funding. Price up + OI up means new positions are driving the move. Price up + OI down is short covering. A sharp OI drop on heavy volume is a liquidation flush. Hyperliquid’s core markets carried $11.05B of OI against $4.03B of 24-hour volume (build of October 20, 2026). Before you compare venues, check the counting method: the same DEX can show numbers about 2× apart on DefiLlama and CoinGecko.
Trade the perp DEX with the most open interest
Hyperliquid shows OI, funding and the order book for 178 markets (as of October 20, 2026). Join with code HOLYGRAIL for 4% off fees on your first $25M of volume.
We earn a commission when you sign up through our links; it never raises your fees.
1. Live ranking: perp DEXs by open interest
The table below is rebuilt from CoinGecko’s derivatives-exchange feed every time the site builds (about every six hours), sorted by open interest. Vol ÷ OI is the daily churn: how many times the open positions turned over in 24 hours. Share is each venue’s part of the open interest across the 20 DEXs tracked here. For fees, leverage and pair counts, see the full perp DEX ranking.
| # | Perp DEX | Open interest | Share | 24h volume | Vol ÷ OI | Trade |
|---|---|---|---|---|---|---|
| 1 | Hyperliquid | $15B | 65.6% | $7.62B | 0.51 | Trade → |
| 2 | Aster | $2.42B | 10.6% | $1.43B | 0.59 | Trade → |
| 3 | Variational Omni | $1.85B | 8.1% | $3B | 1.62 | — |
| 4 | Lighter | $1.1B | 4.8% | $1.96B | 1.79 | Trade → |
| 5 | GRVT | $440M | 1.9% | $454M | 1.03 | — |
| 6 | Lighter (Robinhood Chain) | $419M | 1.8% | $604M | 1.44 | — |
| 7 | edgeX | $362M | 1.6% | $636M | 1.76 | Trade → |
| 8 | Antarctic | $329M | 1.4% | $291M | 0.89 | — |
| 9 | GMX (Solana) | $201M | 0.9% | $236M | 1.17 | — |
| 10 | Extended | $185M | 0.8% | $490M | 2.65 | — |
| 11 | ApeX Omni | $155M | 0.7% | $351M | 2.27 | — |
| 12 | Pacifica | $121M | 0.5% | $826M | 6.81 | — |
| 13 | Backpack | $109M | 0.5% | $136M | 1.25 | — |
| 14 | Orderly | $66.7M | 0.3% | $56.4M | 0.85 | — |
| 15 | GMX (Arbitrum) | $51.8M | 0.2% | $54M | 1.04 | — |
| 16 | dYdX | $44.9M | 0.2% | $36.1M | 0.81 | — |
| 17 | Paradex | $11.2M | 0.0% | $5.29M | 0.47 | — |
| 18 | Helix | $4.33M | 0.0% | $50.8M | 11.75 | — |
| 19 | GMX (Avalanche) | $1.99M | 0.0% | $1.98M | 1.00 | — |
| 20 | SynFutures | $1.95M | 0.0% | $66.9M | 34.36 | — |
Data as of Tue, 20 Oct 2026 00:59 UTC. Source: CoinGecko /derivatives/exchanges (open interest and volume in BTC), converted at Hyperliquid’s BTC mid price of $82,074. CoinGecko does not put venues on one counting basis (Lighter appears at about twice its own API total), so treat absolute levels with care (section 2). Hyperliquid includes its HIP-3 builder markets. “Trade” links carry our referral codes.
How to read it: in this build, Extended turned over its open interest 2.65 times in a day, the fastest among the ten largest, while Hyperliquid turned over only 0.51 times. Very high churn relative to OI often means volume driven by points or fee rebates. OI is harder to inflate because it ties up margin, which is why this page ranks by it.
2. Which number to trust: why DefiLlama, CoinGecko and CryptoRank disagree
The two tools Google puts first for “open interest DEX” are DefiLlama and CoinGecko. For the same DEX at the same hour, they can differ by about 2×. We pulled each venue’s own API and both trackers at about 19:00 UTC on September 26, 2026:
| DEX | Venue’s own API | CoinGecko | DefiLlama | CryptoRank |
|---|---|---|---|---|
| Hyperliquid | Core $12.96B (178 markets) + HIP-3 $3.88B, of which trade.xyz $3.80B | $16.8B (core + HIP-3, as reported) | $8.51B “Hyperliquid Perps” (core + HIP-3, halved) and trade.xyz $3.80B listed separately | $16.75B |
| Lighter | $613M (210 active markets) | $1.23B (about 2× the API) | $614M, plus $226M for Lighter on Robinhood Chain | $605M |
| edgeX | $540M | $540M | $270M (halved) | — |
| Aster | — | $2.42B | $1.43B | — |
Hyperliquid info API (metaAndAssetCtxs, core and every HIP-3 dex), Lighter /api/v1/orderBookDetails (open_interest × mark price), edgeX getTicketSummary; CoinGecko /derivatives/exchanges at BTC $84,010; DefiLlama /overview/open-interest (latest daily value). CryptoRank read at about 19:20 UTC the same day. A snapshot: it will not match the live table above.
Why they differ:
- One side or both. DefiLlama’s open-source adapters halve Hyperliquid’s and edgeX’s figures because it treats them as two-sided; for Hyperliquid its code says it measured the API value at exactly 2× CoinMarketCap’s one-sided figure. It keeps Lighter’s as-is, calling it “already one-sided”. CoinGecko does not normalize: its Hyperliquid and edgeX figures matched what their APIs return, while its Lighter figure was about twice Lighter’s own API total, and CoinGecko does not say why. Hyperliquid’s own docs do not define the field.
- Scope. CoinGecko’s Hyperliquid number includes the HIP-3 builder markets. DefiLlama folds them into “Hyperliquid Perps” (halved) but also lists trade.xyz as its own protocol at full size. Lighter’s Robinhood Chain deployment is a separate row on both.
- Timing. DefiLlama shows a daily value; CoinGecko and the venue APIs are live.
What to do: compare venues inside one tracker, never across two. The order at the top was the same on both on September 26 (counting DefiLlama’s separate trade.xyz row as part of Hyperliquid): Hyperliquid far ahead, then Aster, Variational and Lighter. For a single venue over time, use its own API or one tracker consistently. And if you need a one-sided dollar figure, take DefiLlama’s, or halve the ones you know are two-sided.
3. Hyperliquid open interest
Current value. Hyperliquid’s core perp markets carried $11.05B of open interest in the build of October 20, 2026 (sum of openInterest × mark price across 178 live markets). Including the HIP-3 markets, CoinGecko showed $15B on October 20, 2026, which is 65.6% of the open interest across the perp DEXs in our table. At 19:00 UTC on September 26 the split was $12.96B core plus $3.88B across HIP-3 dexes, almost all of it on trade.xyz ($3.80B; stocks, indices and commodities). The largest core markets were BTC ($3.13B), ETH ($2.96B) and HYPE ($1.89B).
To see which wallets hold that open interest, look them up with the Hyperliquid Explorer & Scan tools.
Where to see it:
- Trade page. The market header above the chart shows open interest, 24h volume and funding for the selected market.
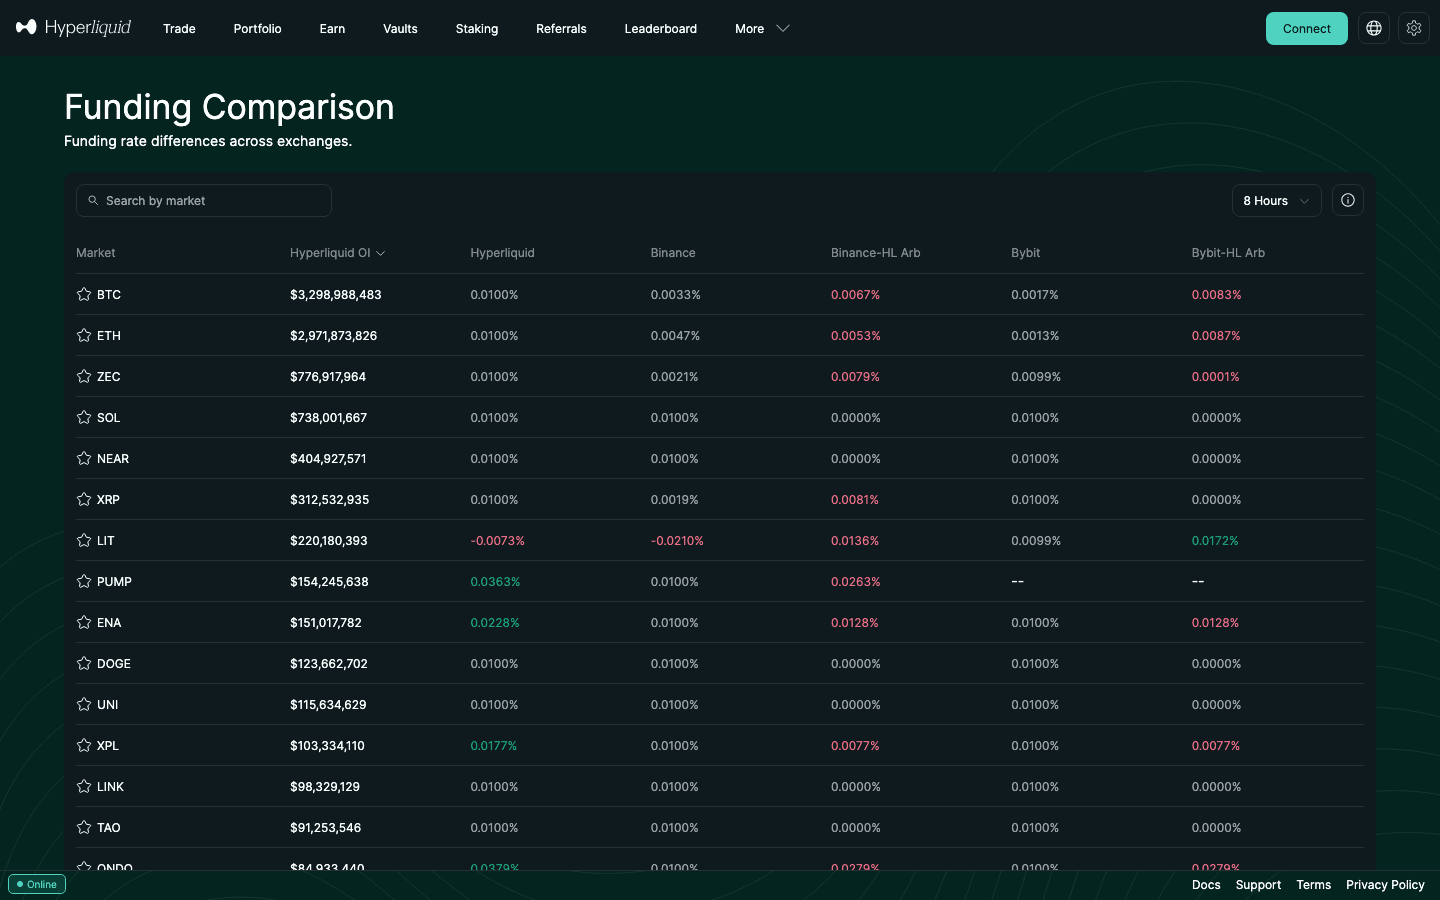
- Funding Comparison page (
app.hyperliquid.xyz/fundingComparison). A table of markets sorted by Hyperliquid OI, next to Binance and Bybit funding. It is the quickest OI ranking inside the app, though it leaves out some markets (HYPE was missing on September 25). - API. POST
{ "type": "metaAndAssetCtxs" }toapi.hyperliquid.xyz/info; add"dex": "xyz"for trade.xyz (section 12). - History. TradingView’s crypto open interest indicator has Hyperliquid from September 2025, Trade[XYZ] HIP-3 from October 2025 and Paragon HIP-3 from April 2026. The HIP-3 markets are not in its aggregated series.
- Every market at once: our Hyperliquid open interest by market table (volume, OI, leverage, funding; rebuilt every six hours).
More on the venue: Hyperliquid review · Hyperliquid fees · how to use Hyperliquid.
4. Lighter open interest
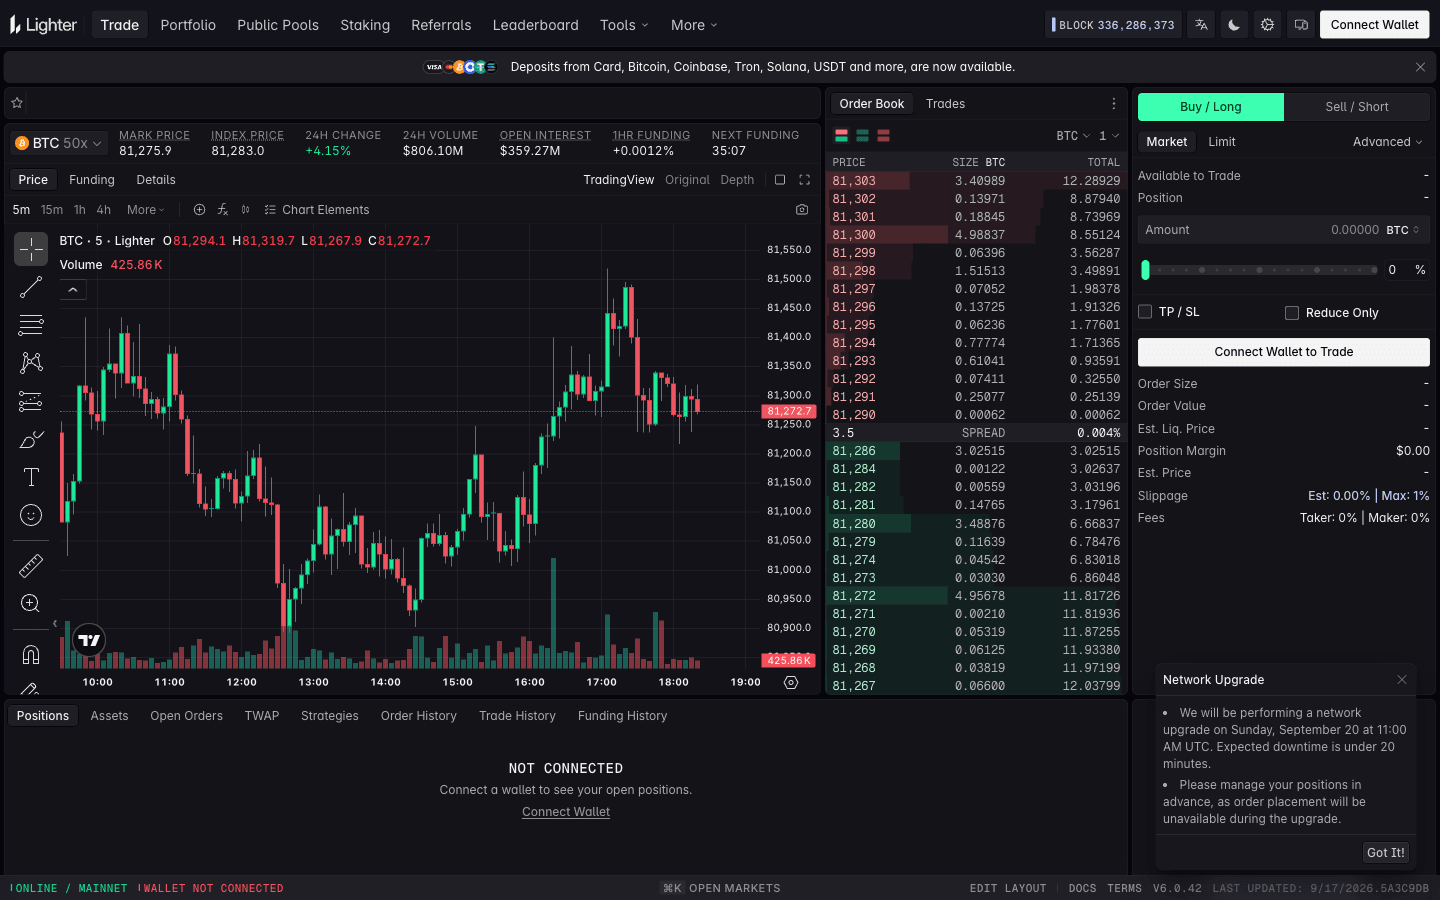
Current value. CoinGecko showed Lighter at $1.1B of open interest on October 20, 2026, number 4 among perp DEXs by OI and 4.8% of the table. Treat that level with care. Summing Lighter’s own API at 19:00 UTC on September 26 gave $613M across 210 active markets, about half of CoinGecko’s figure at the same hour, and DefiLlama (which calls Lighter’s field one-sided) showed $614M. The largest markets were BTC ($166M), ETH ($111M) and Lighter’s own LIT token ($56M). The same API showed about $621M of 24-hour volume, roughly 1× its open interest.
Where to see it: the trade page header shows Open Interest for each market next to mark price, 24h volume and the 1-hour funding rate. By API, GET https://mainnet.zklighter.elliot.ai/api/v1/orderBookDetails returns open_interest (in the base asset) and mark_price for every market; multiply and sum the active ones. Lighter’s deployment on Robinhood Chain is tracked as a separate venue (DefiLlama showed another $226M there).
Trading on Lighter?
Sign up with code 718610TD and your first week of Premium fees is rebated. Compare the two venues in Hyperliquid vs Lighter.
5. What open interest counts, with a worked example
Every derivatives position has a counterparty. If you are long 1 BTC in a perpetual, someone is short 1 BTC. Open interest adds up the positions that are still open. The standard convention counts one side, so total open longs equal total open shorts, and OI equals either one (not every venue follows it; section 8). Hyperliquid’s API reports OI in coins. Multiply by the mark price for the dollar value: 39,983 BTC × $84,800 ≈ $3.39B at 09:31 UTC on September 25, 2026.
Follow one hypothetical market through a day. It starts with 100 BTC of open interest:
| Trade | What happens | Open interest | Volume so far (BTC) |
|---|---|---|---|
| Start of the day | — | 100 BTC | 0 |
| Ana opens a 10 BTC long; Ben opens a 10 BTC short against her | Two new positions | 110 BTC (+10) | 10 |
| Cara closes a 5 BTC long; Dan closes a 5 BTC short against her | Two positions shrink | 105 BTC (−5) | 15 |
| Eve opens an 8 BTC long; Finn closes his 8 BTC long by selling to her | A position changes hands | 105 BTC (0) | 23 |
| Gil’s 3 BTC long is liquidated; the engine sells it to Hana, who is closing a short | Forced close meets a close | 102 BTC (−3) | 26 |
By the end of the day, 26 BTC traded but OI moved only from 100 to 102. That gap is the whole point: volume says trades happened; OI says whether they added exposure or took some away. The general rules:
| Trade | Effect on open interest |
|---|---|
| New buyer opens a long, new seller opens a short | Rises |
| New long meets a trader closing a short (or new short meets a closing long) | Unchanged |
| A trader closing a long meets a trader closing a short | Falls |
| A long is liquidated and a new short takes the other side | Unchanged |
| A long is liquidated and a short holder closes against it | Falls |
OI never tells you who is long. Longs and shorts are always equal. What changes is who is paying to hold, which is what funding shows.
6. Open interest vs volume
Volume is the notional that changed hands over a window. Hyperliquid’s dayNtlVlm covers a rolling 24 hours. OI is what is still open right now. Divide volume by OI and you get a churn ratio: how many times the open positions turn over per day.
- Exchange-wide (Hyperliquid core, build of October 20, 2026): $4.03B ÷ $11.05B = 0.37.
- High churn among markets with more than $50M of OI (snapshot, September 25): ONDO 1.95, BTC 1.03, XPL 1.01, NEAR 0.73. These are dominated by intraday trading, so positioning changes within hours.
- Low churn (same snapshot): BNB 0.14, AAVE 0.16, ZRO 0.20, DOGE 0.21. Positions here are held rather than traded, so a 5% OI change took days to build and matters more.
Across exchanges, the same ratio helps you spot inflated volume. The Vol ÷ OI column in the live table does this for every DEX.
7. Is high open interest good? Does it mean liquidity?
For a venue: mostly yes. OI is money traders are willing to leave on the exchange as margin, so it is a better measure of trust and real usage than volume. That is why we rank DEXs by it.
But OI is not liquidity. Liquidity is how much you can trade near the current price: order-book depth and spread. OI is how much is already positioned. A market can hold a lot of OI that rarely trades. On September 26, trade.xyz carried $3.80B of OI against $0.52B of 24-hour volume, a churn of about 0.14. Before a large order, check the book, not the OI.
For a single market: high OI relative to its own history means more leverage is waiting to be unwound. That is fuel for sharp moves in either direction, not a buy or sell signal. Read it with funding (section 10) and a liquidation map.
8. One-sided vs two-sided reporting
This is the detail most OI explainers skip, and it can double a number. Exchanges do not all count the same way:
| Venue | Headline OI (date) | What the API gives | One side or both? |
|---|---|---|---|
| Hyperliquid | $11.05B core (October 20, 2026); $15B on CoinGecko incl. HIP-3 (October 20, 2026) | openInterest per market, in coins | Not stated in the docs; DefiLlama treats it as both sides |
| Binance | $35.0B (CoinGecko, Sep 25) | openInterest in coins; 30 days of history | Not labeled |
| Bybit | $15.1B (CoinGecko, Sep 25) | openInterest and singleOpenInterest | Both, clearly labeled |
| GMX | $273.1M (Sep 25) | Long OI and short OI, plus a total | Total = long + short |
| dYdX | $54.2M (Sep 25) | openInterest per market (indexer) | Not stated |
| Polymarket Perps | $62.7M (Sep 24) | Exchange stats | Labeled “one-sided” |
Hyperliquid core from the registry’s live fact (its API); the other rows from their own APIs and docs or CoinGecko’s derivatives API (converted at BTC $84,700), read at about 09:30 UTC on September 25, 2026; Polymarket Perps from its exchange stats (September 24).
Bybit is explicit. Its v5 docs define openInterest as “the sum of both sides” and singleOpenInterest as “the single side”. On September 25 the BTCUSDT values were 60,214.57 and 30,107.29 BTC, exactly half. GMX publishes long OI ($138.4M) and short OI ($134.7M) and adds them into a $273.1M total. Polymarket Perps labels its figure one-sided. Hyperliquid and dYdX return one OI field per market and do not say which convention they use. DefiLlama treats Hyperliquid’s as two-sided (section 2).
Why it matters: CoinGecko listed Bybit’s BTCUSDT OI at $5.03B on September 25. That is Bybit’s both-sides value; one side was about $2.52B. The same page showed Binance BTCUSDT at $8.15B and Hyperliquid BTC at $3.37B. So “Hyperliquid BTC OI is two-thirds of Bybit’s” and “Hyperliquid BTC OI is larger than Bybit’s” can both come from the same data, depending on which number you use. Before comparing venues, check the label, or compare each venue only with itself over time.
9. Snapshot: Hyperliquid’s largest markets
A dated snapshot from metaAndAssetCtxs at 09:31 UTC on September 25, 2026, when Hyperliquid had 178 live perp markets. The API also returns delisted entries, so filter them out before summing. For current values, use the Hyperliquid markets table.
| Market | OI (coins) | Mark | OI (USD) | 24h volume | Vol ÷ OI | 24h price |
|---|---|---|---|---|---|---|
| BTC | 39,983 BTC | $84,800 | $3.39B | $3.49B | 1.03 | +1.8% |
| ETH | 1.07M ETH | $2,713 | $2.91B | $0.98B | 0.34 | +2.2% |
| HYPE | 21.0M HYPE | $93.93 | $1.98B | $0.67B | 0.34 | +3.2% |
| ZEC | 539K ZEC | $1,590 | $0.86B | $0.56B | 0.65 | +6.6% |
| SOL | 5.95M SOL | $118.65 | $0.71B | $0.28B | 0.40 | +4.7% |
Three things stood out. Concentration: BTC was 25.7% of exchange OI and the top five 74.7%. Only 14 markets had more than $100M of OI, and 23 had more than $50M. HYPE and ETH are held, not traded: each had about three dollars of OI for every dollar of daily volume. Funding was calm on the majors: all five sat at the 0.00125%/hour baseline despite gains of 2–7%. NEAR was different. It rose 18.8% in 24 hours and paid 0.0051% per hour, four times the baseline, so longs were paying up to hold it. The HIP-3 markets sit on top of this; details in trade.xyz on Hyperliquid.
10. Reading OI with price, volume and funding
| Price | OI | Volume | What is happening | How to read it |
|---|---|---|---|---|
| Up | Up | Above average | New positions are opening and buyers are the aggressive side | Trend confirmation. If funding climbs well above baseline, longs are paying up and the trade is getting crowded |
| Up | Down | Any | Shorts are closing (buying back); little new commitment | Short covering. These rallies often fade once the covering is done |
| Down | Up | Above average | New positions are opening and sellers are the aggressive side | Bearish confirmation. Deeply negative funding means shorts are crowded, which sets up squeezes |
| Down | Down | Spiking | Longs are closing or being liquidated | A liquidation flush. Flushes often mark local lows once OI stops falling |
| Flat | Up | Normal or low | Positions are building while price is pinned in a range | Pressure is loading up. Funding tells you which side is paying; the break often comes toward the side that is not |
| Flat | Down | Low | Traders are leaving the market | Interest is fading. Expect a quiet range and thinner books until a catalyst |
Volume separates conviction from drift: an OI change on above-average volume shows commitment, and the same change on thin volume means little. Funding shows who is paying. Hyperliquid charges funding every hour. It has an interest component of 0.00125%/hour, which longs pay shorts even when the perp trades flat to the oracle, and a cap of 4% per hour. Rising OI with funding far above baseline means the new positions are longs paying a premium. At 0.05%/hour, a $10,000 long pays $120 a day. The mechanics are in our Hyperliquid funding rate guide.
11. Dated examples from September 2026
Hyperliquid’s API returns only current OI, so for history we use Binance’s public openInterestHist (daily snapshots at 00:00 UTC) for BTCUSDT, with daily prices from its klines:
| Day (UTC) | BTC price | Binance OI (BTC) | Reading |
|---|---|---|---|
| Sep 3 | 77,300 → 81,231 (+5.1%) | 107,652 → 112,718 (+4.7%) | Price ↑ OI ↑: new positions came in with the rally. The next day OI fell back to 107,913 and price gave up 2% |
| Sep 21 | 81,144 → 86,579 (+6.7%) | 107,778 → 109,189 (+1.3%) | Dollar OI rose 8% ($8.75B → $9.45B), but coin OI only 1.3%. Most of the “OI jump” was price |
| Sep 23 | 86,159 → 84,355 (−2.1%) | 106,720 → 98,503 (−7.7%) | Price ↓ OI ↓: longs closed or were liquidated. OI fell again to 95,873 the next day while price went flat |
Binance fapi futures/data/openInterestHist period=1d and fapi/v1/klines 1d, fetched September 25, 2026. OI is the 00:00 UTC snapshot before and after each day.
The September 21 row is the lesson most people miss. Dollar OI rose 8%, but almost all of that was price. Over the whole window, Binance BTC OI went from 105,594 BTC on August 27 to 95,873 BTC on September 25. That is its lowest reading in the 30 days, even though BTC traded about 6–7% higher. So the September rally ended with less leverage in the market, not more.
12. Where to get open interest data
- Hyperliquid API (no key). POST
{ "type": "metaAndAssetCtxs" }tohttps://api.hyperliquid.xyz/info. The response pairsuniverse(name, maxLeverage, isDelisted) with asset contexts in the same order. Each context hasopenInterest(coins),markPx,dayNtlVlm,funding,premiumandprevDayPx. Add"dex": "xyz"for trade.xyz;{ "type": "perpDexs" }lists every HIP-3 dex. The call gives the current value only, so log it hourly to build your own history. See the Hyperliquid API guide. - Lighter API (no key).
/api/v1/orderBookDetailsreturnsopen_interest,mark_priceand daily volume for every market (section 4). - DefiLlama open interest. A sortable, filterable table of perp DEXs (and prediction markets) with history and CSV export. It normalizes to one side where it believes a venue reports two (section 2).
- CoinGecko derivatives. Exchange-level OI (in BTC) and per-contract
open_interest_usdfor most perp DEXs and CEXs, without normalizing the counting method. Our live table uses this feed. - Exchange APIs with history. Binance
futures/data/openInterestHistgives 30 days. Bybit/v5/market/open-interestgives both-sides and single-side values. dYdX’s indexer candles includestartingOpenInterest. GMX’s stats API splits long and short. - TradingView. The crypto open interest indicator covers the big CEXs from February 2020 and Hyperliquid from September 2025, with Trade[XYZ] and Paragon HIP-3 markets available per symbol but not in the aggregate. It also plots Hyperliquid funding, liquidations and long/short ratios.
- Per-account data. On Hyperliquid, large individual positions are public. See the whale tracker guide and the liquidation map.
See OI, funding and the book in one screen
Hyperliquid puts open interest and funding in every market header and lets you pull them from a free API. Code HOLYGRAIL takes 4% off your fees.
13. Comparing DEX and CEX open interest
The biggest CEXs still hold more open interest than any DEX. CoinGecko’s exchange-level figures at 09:30 UTC on September 25, 2026 (converted at BTC $84,700): Binance $35.0B, Bybit $15.1B (both-sides convention), OKX $8.0B. Set Hyperliquid’s $15B on the same feed (latest build, HIP-3 included) against those, and remember that a one-sided comparison would roughly halve Bybit’s number. Three rules for lists like this:
- Check the counting method first. Bybit’s headline figure counts both sides; DefiLlama halves Hyperliquid’s and edgeX’s.
- Compare OI with volume. High churn relative to OI often points to incentive-driven volume (Vol ÷ OI column above).
- OI is harder to fake than volume, because it ties up margin. Head-to-heads: Hyperliquid vs dYdX, Hyperliquid vs GMX, Hyperliquid vs Bybit, and the DEX vs CEX fee comparison.
14. Five ways to use OI in a trading plan
- Confirm a breakout before chasing it. When a level breaks, check whether OI (in coins) rose through the break. If price moved but OI did not, it was covering or a sweep of a thin book. Wait for a retest.
- Watch divergence at highs and lows. Price makes a higher high while OI makes a lower high, so fewer positions are carrying the move. That is a fade setup only with a tight stop, because divergences can last longer than your margin.
- Trade after the flush, not during it. Price gaps down, volume spikes, OI drops several percent within an hour and funding snaps toward zero. Forced sellers are done once OI stops falling, and that is when entries have the best risk-reward.
- Use funding and OI together as a crowding filter. Don’t add to a long when OI is at a multi-week high and funding is several times baseline. The holding cost eats the trade, and the crowded side is the one that gets liquidated.
- Pick markets with enough OI. Below a few tens of millions of dollars, one participant can dominate positioning and OI turns into noise. On September 25, about 23 Hyperliquid markets had more than $50M. Treat the rest as event-driven. Size positions with the liquidation price calculator in mind.
15. Pitfalls
- Dollar OI moves with price. Compare OI in coins, or deflate it by price, before calling a change in positioning (see September 21 above).
- Mixed conventions and scopes. Adding Bybit’s both-sides OI to one-side figures overstates the total, and so does adding trade.xyz on top of a Hyperliquid figure that already includes it.
- OI is symmetric. It cannot tell you the long/short split. Funding and price direction show which side is aggressive.
- One reading is only a level. Every pattern above is a change, so you need a series before direction means anything.
- Delisted and builder markets. On Hyperliquid, sum the main dex without delisted entries, and add HIP-3 dexes only on purpose.
- Incentives distort. Points programs can reward holding OI as well as trading volume, so part of a venue’s OI may exist to farm rewards.
16. FAQ
What is open interest in crypto?
Open interest (OI) is the total size of futures or perpetual contracts that are still open, not yet closed or settled. Every long is matched by a short, so the usual convention counts one side. It is a stock of live, margin-backed exposure; volume is the flow of trades. Among perp DEXs, Hyperliquid carried the most open interest in our ranking built on October 20, 2026: $15B, 65.6% of the 20 DEXs tracked.
Which perp DEX has the most open interest?
Hyperliquid, by a wide margin. In the ranking built on October 20, 2026 from CoinGecko data it held $15B of open interest, 65.6% of the 20 perp DEXs tracked; the next largest was Aster at $2.42B. DefiLlama shows smaller absolute numbers because it halves Hyperliquid’s figure and lists trade.xyz separately, but the order at the top is the same.
What is the difference between open interest and volume?
Volume counts how much traded over a period; open interest counts how much is still open at a moment. Volume is a flow, OI is a stock. A market can trade huge volume with flat OI if traders open and close within the day. On Hyperliquid’s core markets, 24-hour volume was $4.03B against $11.05B of open interest (a ratio of 0.37) in the build of October 20, 2026.
Is rising open interest bullish or bearish?
Neither on its own. Rising OI means new positions are being opened, and every new long has a new short on the other side. Read it with price: price up with OI up means buyers are pushing in new positions; price down with OI up means sellers are. Falling OI means positions are closing, which weakens a move in either direction.
Is high open interest good? Does it mean more liquidity?
For choosing a venue or a market, higher OI is usually a good sign: traders are willing to leave margin there, and it is harder to fake than volume. But OI is not liquidity. Liquidity is how much you can trade near the current price, which you read from the order book depth and spread. A market can hold large OI that rarely trades; on September 26, 2026, trade.xyz on Hyperliquid carried $3.80B of OI against $0.52B of 24-hour volume.
What happens if open interest is very high?
A lot of leveraged exposure is open, so a sharp move can force many liquidations at once. It is not a signal by itself. Check funding (which side is paying), whether OI is high relative to the market’s usual level, and where liquidation clusters sit. Record-high OI with funding several times its baseline is the classic setup for a squeeze.
Why do open interest figures differ between DefiLlama, CoinGecko and CryptoRank?
Three reasons. Counting: some venues report both sides and some one side, and DefiLlama halves figures it believes are two-sided (Hyperliquid, edgeX) while CoinGecko does not normalize them. Scope: Hyperliquid’s builder-deployed HIP-3 markets such as trade.xyz are inside Hyperliquid’s number on CoinGecko but a separate row on DefiLlama. Timing: DefiLlama shows a daily value, CoinGecko a live one. On September 26, 2026, Lighter’s own API summed to $613M, DefiLlama showed $614M and CoinGecko $1.23B.
Is open interest counted once or twice?
It depends on the venue, and this is the most common mistake in cross-exchange comparisons. Bybit’s API returns openInterest as “the sum of both sides” and a separate singleOpenInterest, which was exactly half on September 25, 2026 (60,214.57 vs 30,107.29 BTC). GMX publishes long OI plus short OI and adds them. Polymarket Perps labels its figure one-sided. Hyperliquid’s docs do not define its field; DefiLlama’s adapter treats it as both sides and halves it.
Can open interest predict a liquidation cascade?
It can tell you the fuel is there, not when it ignites. Cascades need a lot of leveraged OI, crowding on one side (funding well above or below baseline) and a price move into the zone where those positions get liquidated. Watch OI in coins together with funding and a liquidation map; a fast OI drop on a volume spike is the cascade happening, and OI that stops falling is usually the end of it.
Which DEX is best for perps?
For most traders, Hyperliquid: it has the most open interest of any perp DEX ($15B on October 20, 2026), the deepest on-chain order books and 178 core markets, and code HOLYGRAIL takes 4% off fees on the first $25M of volume. Lighter suits fee-sensitive traders, and Aster suits limit-order strategies. Our perp DEX ranking compares about 20 venues by volume, OI and fees.
Where can I see open interest for Hyperliquid and Lighter?
Both apps show open interest in the market header above the chart. Hyperliquid’s Funding Comparison page also lists markets sorted by Hyperliquid OI. By API, POST type metaAndAssetCtxs to api.hyperliquid.xyz/info (openInterest in coins per market), or GET Lighter’s /api/v1/orderBookDetails (open_interest per market). Our perp DEX table on this page and our Hyperliquid markets table rebuild every six hours; TradingView charts Hyperliquid OI from September 2025.
Why does open interest in dollars change when nobody trades?
Because dollar OI is coins times price. On September 21, 2026 BTC rose 6.7% on Binance and dollar open interest rose about 8%, but open interest in BTC rose only 1.3%. Compare OI in coins, or adjust for price, before concluding that positioning changed.
Put the signal to work on Hyperliquid
The most open interest of any perp DEX, gas-free orders and 4% off fees with HOLYGRAIL.
Also trading elsewhere? Lighter with code 718610TD (first week of Premium fees rebated), Aster with code DTLpLc or edgeX with code HOLYGRAIL.
Disclosure: HOLYGRAIL (Hyperliquid, edgeX), 718610TD (Lighter) and DTLpLc (Aster) are our referral codes, and we earn a share of referred accounts’ fees at no cost to you. The ranking table and Hyperliquid totals are rebuilt from the CoinGecko and Hyperliquid APIs every six hours; the tracker comparison was read at about 19:00 UTC on September 26, 2026 from the Hyperliquid, Lighter and edgeX APIs, CoinGecko and DefiLlama; other figures are dated where they appear. Open interest changes by the minute. Not investment advice.